This guide shows how to link the AI results to a project. You must first create and save a Slideform AI Assistant . You must also have a Project with a report template saved in Slideform.
1. Enable the Slideform Analyst for your project
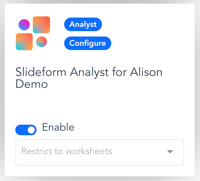
Click Configure on your Project card and go to the Data Sources tab at the top of the page.
Click the Enable toggle for the Slideform Analyst data source. This makes the Slideform Analyst outputs available for this template and automation project.
2. Match the Slideform Analyst output to placeholders in the template
 AI Analyst results in the form of charts, data tables, and text fields can be pulled into placeholders in your report template. The process is the same as mapping any other data to the template.
- Open the project with the Configure button. Locate the placeholder / pragma in the list.
- Select the Slideform Analyst as the data source.
- Select "Choose a Metric".
- Select the worksheet. Most assistants will be in "All Metrics" unless you have created folders to organize your saved insights.
- Select the correct insight and Save the project mapping.
- Formatting and placement of the data into the report work the same as any other data source.
3. Generate the report
Click Generate on the project card to create a new report output.
A progress meter will show you that the system is working, and a results preview may appear unless your project has disabled previews. Any errors or Q/A warnings will also be displayed.
Results will be shown under the Results list on the main page.
To set a schedule for reports, see Schedules for Recurring Presentations.