Now we'll walk through a simple slide deck that pulls client data from a Google Sheet. The slide template looks like this:  Each time I generate the deck for a different client, Slideform will pull in different information on slides 1 & 2 for the client name, client logo, and other account specific data.
Slides 3 & 4 contain sales summary data, charts, and tables that come from a different Google Sheet.
The template has been linked to Slideform as a New Project.
The Google Sheet
Below is the spreadsheet that contains the client account information. Each line corresponds to a client.

I also connected a sales overview sheet that has KPIs, text, charts, and data tables. These data will be used on slides 3 & 4 in my deck. 
I have connected both Google Sheets as a data source in Slideform.
The Configure Data screen
Let's take a look at how to connect the data to the slide template. 
Click Configure Data on the project card to open it. On the configuration page you will see the project name & description, a link to the template file, and below that a series of blue boxes representing each of the placeholders in the template.
Set the client - {{client}}
First, enter a prompt for this placeholder. This is what the user will see. I want the user to "Select the client:".
Click the "Preset a Value" button to set up the options that will be shown in the dropdown.
For help setting up a dropdown menu, see How to create a dropdown menu
Built-in Slideform functions - {{fn:date}}
Pull an image from the sheet - {{image:client logo}} 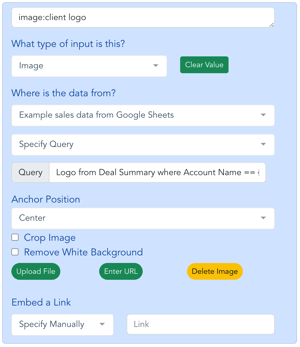
Logo from Deal Summary where Account Name ==
where
Logo is the column that has the images
Deal Summary is the worksheet name
Account Name is the column that has the client names
{{client}} is the placeholder that we set up to hold the client name.
This means that once the {{client}} is selected from the dropdown, the logo image will be pulled from the corresponding row of the sheet.
You can also set the anchor position, cropping, and embed a link behind the image if you want.
Data lookups from a Google Sheet - {{close date}} 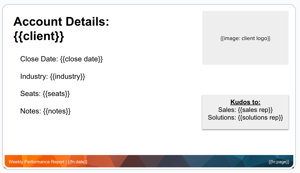
-
{{client}} and {{image: client logo}} have already been mapped to data.
-
{{close date}} and all the other placeholders will be looked up based on the client name.
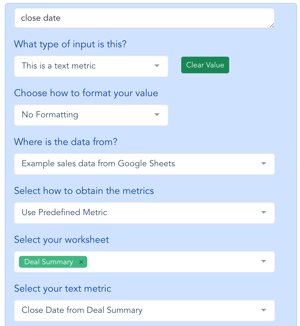
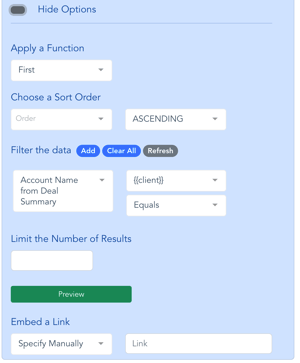
Then, choose {{client}} as the lookup key.
Now Slideform will pull the close date for the specific client that I set in the {{client}} placeholder!
I'll repeat this lookup logic for all the other client-specific placeholders on slide 2.
Pull data from a specific cell in the sheet - {{leads}}
Slide 3 includes placeholders that will be filled from the sales overview sheet. These data are hard-coded to specific cells in the Google Sheet and the cell will not change from one client to another or from week to week.
Click the "Preset a Value" button to set up the data linkage.
=Dashboard!H10Pull in a Google Sheets chart - {{chart:wins this month}}

Pull in an editable table of data - {{data:new accounts table}} 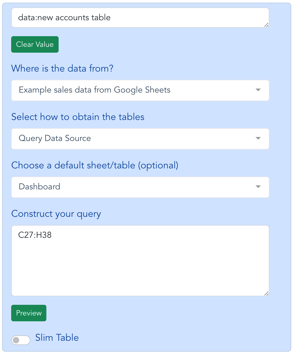
We will pull in a table from the Google Sheet into the {{data:new accounts table}} placeholder. All data table placeholders must begin with the word "data:" and they must be associated with a shape in the slide template. For more, see How to import tables.
To set this up, click "Preset a value" and select the data source. Then set to Query Data Source and choose the worksheet. Enter the cell range for the data table in Excel syntax, such as C27:H38.
The formatting, color, and font of the data in this table will be pulled into the slides.
If the cell range includes empty rows or columns beyond the data, you can trim those off with the "Slim Table" option.
Google Slides Results
Here is the output for a specific client:
