In this step, we will tell Slideform how to fill in each pragma in your slide deck template. There are many ways to pull information into your pragmas. You have the option to type in the values when you generate the slides, or you can dynamically fill it in from a data source. Either way, your slides will be formatted beautifully each time you generate the presentation.
Note: you must have already uploaded a slide template to Slideform. You may also need to connect a data source to pull in charts, tables, and metrics.
Step 1: Enable Data Sources for your Project
The first step is to open your project with the Configure Data button. At the top of the page you will see several tabs.
Click on Data Sources and make sure that the data you want to use is Enabled for this project. You can enable one or more specific worksheets or dashboard pages if you wish. Save the project to save your selections.

Step 2: Match each pragma to the appropriate data
Next, on the Configure Data page, you will see all the pragmas in your template represented by blue boxes. Data mapping differs depending on what type of pragma you have. See below for details on each type.
Basic pragma types
- Text, numbers & dates from a spreadsheet
- Numbers and KPIs from a dashboard
- Data from an SQL query
- Images
- Charts & graphs
- Video
- Data tables
Advanced data mapping capabilities
- How to create a dropdown menu
- Formatting numbers, percents, dates, and currency values
- Using formulas to calculate a pragma value
- Built-in pragmas for dates and page numbers
- Using hidden pragmas
- How to control slide visibility
- Pull in slides from a different deck
- Using data filters, sorting, and column selection
Additional Resources:
❗ Be sure to save the data mapping by clicking save at the bottom of the page!
Text, numbers, KPIs, and dates
To insert text or numeric values into your deck, use a placeholder "pragma" enclosed in curly braces in your slide template, such as:
{{client name}}
A pragma can appear more than once in the slide deck. The font size, color, and placement of the text will follow that of the text in the template.
Google Sheets or Airtable:
To pull in the correct data into a text or number pragma, first click Preset a Value. This means that you are going to set a mapping for this pragma.
Then, select your data source under "Where is the data from?"
If you don't see your data source in the dropdown, then go to the Data Sources tab at the top of the page and Enable the correct data source.
To import text or a number from Google Sheets or Airtable, choose "Select Metrics" and then select your worksheet and your KPI or column. Preview the data to see what has been mapped. You may further refine the selection using filters and lookups.
To specify a single cell from a spreadsheet, choose "Query Source". Then you may enter the sheet and the query in the dialog box using standard Excel syntax, such as "B10" (pull the data from cell B10).
To format text as a clickable link, select Link under the Choose how to format your value box.
Numeric Values & KPIs from a dashboard:
With Slideform you can embed numbers and KPIs directly from your dashboard into a text box in the presentation.

In your slide template, create a text box with a placeholder "pragma" enclosed in curly braces, such as:
Impressions: {{impressions}}
In Slideform, go to Configure Data on your project, and find the pragma that will hold the KPI value. Set the appropriate formatting type, then click Preset a Value.

Then, select your data source under "Where is the data from?"
If you don't see your data source in the dropdown, then go to the Data Sources tab at the top of the page and Enable the correct data source.

Slideform captures the numbers behind most dashboard elements in data tables. It is useful tocheck your data source in the Data Sources page. Identify which table contains the KPI you are interested in and preview the table to examine the column headers for the table.
To pull a KPI from a dashboard table, select "Query From Table" under Select how to obtain the metrics. Then select the worksheet and table from the dropdowns.
Under Choose Columns, you must select the correct column that contains the KPI.
If you need to filter the data by date range or other values, you can set the filter to be applied to this KPI.
Finally, it is useful to Preview the data before saving the project. Note, it can take some time to pull in filtered data for preview.
You do not need change the default values for anchor position, table theme, sort order, or apply a function.
Numeric or text data from an SQL query:
With Slideform you can embed numbers and text directly from your database into a text box in the presentation.
In your slide template, create a text box with a placeholder "pragma" enclosed in curly braces, such as:
Impressions: {{impressions}}
In Slideform, go to Configure Data on your project, and find the pragma that will hold the data value. Set the appropriate formatting type, then click Preset a Value.
- Select the data source.
- Select "Query Data Source" and select the database table.
- Enter a query in SQL syntax.
Example query for a single value
SELECT COUNT(*)
FROM Cocktails.Recipes
WHERE `Primary Liquor` = 'gin'
Click Preview to see the data value returned by the query.
Images
Use an image pragma as a placeholder for a graphic, such as a PNG, webp, or JPEG. You can save the image files in Google Drive or upload them to Slideform itself for convenient use.
Note: An image pragma has the format {{image:pragma_name}} , beginning with "image:" in the pragma. It must be a shape object in the slide template. The shape defines the maximum boundaries of the image in the presentation. For guidance on creating image pragmas, see How to create a slide deck template
To set up an image pragma, first click Preset a Value. Then decide where the image will come from: a data source (Google Drive), from a publicly-accessible URL (such as Instagram), or saved in Slideform.
Images saved in your Slideform account

To save images for future use, click Upload File. Then you can select the image from the dropdown in the Select Image box.
To delete an image from your account, choose the image from the dropdown and click Delete Image.
Images from a URL
Enter a name for the image and a static URL that points to your image. This image will be pulled into the slides when they are generated.
Images from Google Drive
You may save images in Google Drive and pull them into your presentation. This is especially useful for client logos and staff photos.
- Upload the images to Google Drive and share them with share@slideform.co
- Create a Google Sheet with at least two columns: one column will hold a link to the image in google drive, and the other column will hold the name or other identifier for the image.
- In Google Drive, copy the link to the image and paste it into the Google Sheet.

- Share the Google Sheet with share@slideform.co and add it as a Data Source in Slideform (see How to Connect a Data Source ).
- In the Configure Data screen of your project, find the image pragma, then select Preset a Value. Select your data source (Google Sheet) and choose "Use Predefined KPIs". This means that you will use the column headings from the sheet to identify the data you need. Then select your sheet and the column / KPI where the image link is stored. You may then use the filters to choose the correct row within that column that corresponds to the image you want.
- Alternatively, you may choose "Specify Query" under the data source. Then you can enter an Excel formula (such as Sheet1!D4) to select the correct cell from the Google Sheet.
Image options
- Anchor Position: You may anchor the image in the top left corner of the placeholder shape or in the center of the shape.
- Crop Image: You may automatically crop the image to the placeholder shape boundaries. This is very helpful when cropping an image to a circle or other non-rectangular shape.
- Remove White Background: You may automatically remove a white background from an image or logo.
- Embed a Link: You may enter a link so that the image is clickable and will direct to this link.
Charts & Graphs
To embed a chart or graphs from a data source into your slide deck, use a chart pragma. Like an image pragma, the chart pragma must be inside a shape object in the slide template. The shape defines the maximum boundaries of the chart in the presentation.
The syntax for the pragma is:
{{chart:chart_name}}
To set up a chart pragma, first click Preset a Value. Then select the data source under "Where is the data from?"
Next choose the correct worksheet or dashboard page and chart from your data source. The options may differ depending on the type of data source.
An example mapping for a chart from Looker Studio is shown to the right.
Chart Options:
- Select an Image allows you to insert a static image, rather than a chart, into the pragma. It works the same as the regular image pragmas described above.
- Anchor Position may be set to the top left corner of the placeholder shape or the center of the shape.
- Filters: depending on the filters set for your data source, you can filter your chart dynamically to pull in specific data.
- Preview: Click preview to see the chart. Note this can take some time depending on the responsiveness of the data source.
Use a chart pragma to pull in charts and Google Sheets Timelines, pivot charts, scorecard elements, dashboard tables, and even slides from other presentations.
Videos
Use a video pragma as a placeholder for a video from YouTube or a file stored in Google Drive. Video embedding is supported for Google Slides output only, not Powerpoint.
Note: A video pragma has the format {{video:pragma_name}} , beginning with "video:" in the pragma. It should be located inside a shape object in the slide template. The shape defines the maximum boundaries of the video in the presentation.
To set up a video pragma, first click Preset a Value. Then decide where the video's URL will come from: type in the URL, or look it up in a data source.
Enter the Video URL
If you know the video URL to embed, you may enter it in the URL box. Slideform supports YouTube URLs as well as Google Drive file URLs.

Pull video URL from a Google Sheet
Select Preset a Value. Select your data source (Google Sheet) and choose "Use Predefined KPIs". This means that you will use the column headings from the sheet to identify the data you need. Then select your sheet and the column / KPI where the video link is stored. You may then use the filters to choose the correct row within that column that corresponds to the video you want.
Data Tables
To embed a table from a data source into your slide deck, use a data pragma. Like an image pragma, the data pragma must be inside a shape object in the slide template. The shape defines the maximum boundaries of the table in the presentation.
The syntax for the pragma is:
{{data:table_name}}
- To set up a data pragma, first click Preset a Value.
- Then select the data source under "Where is the data from?"
- Next choose the correct worksheet or dashboard page and table from your data source. The options may differ depending on the type of data source.
Choose Select an Image if you already have a screenshot or image of the table. This treats the data table the same as an image pragma.
Table from a spreadsheet
Next you need to Select how to obtain the table. There are two options:
Use Predefined Tables
Currently, support for pre-defined tables is limited to Pivot Tables in Google Sheets and Excel. If you want to insert a pivot table into your slides, you select the Pivot Table worksheet and table from the dropdown menus. Fonts, borders, and color from the pivot table will be preserved in the slides.

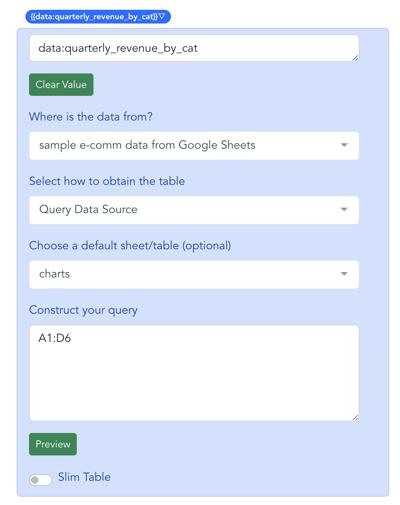
Query Data Source: Insert a pre-formatted table from a range of cells
Here is an example table from a sheet. It has borders, colors, and other formatting that I want to pull through into my slide deck.

To insert the table into my slides, I chose Query Data Source and then selected the sheet. Then I entered the cell range that contains the data (A1:D6).
You can also enter more sophisticated SQL queries to select data from spreadsheets and other types of data sources.
Option: Slim table
Toggle the Slim Table option on to "crop" the table down to only those rows and columns that contain data. For example, I might enter the range A1:D100 for the table example above. Since only rows 1 - 6 contain data, those are the only rows that would be shown in the presentation. This is useful if you do not know ahead of time how many rows or columns your table may have.
Option: Preview
Click the preview button to see the data that will be displayed int he selected table. Note that the preview does not apply formatting to the table.
Table from a dashboard
To embed a data table from your dashboard, first choose Preset a Value and select the data source under "Where is the data from?"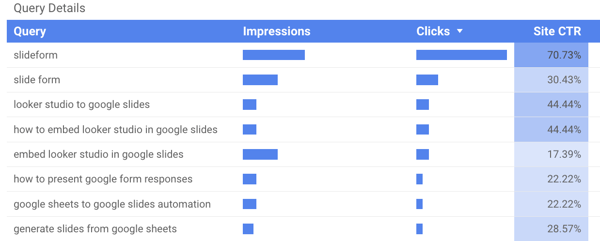
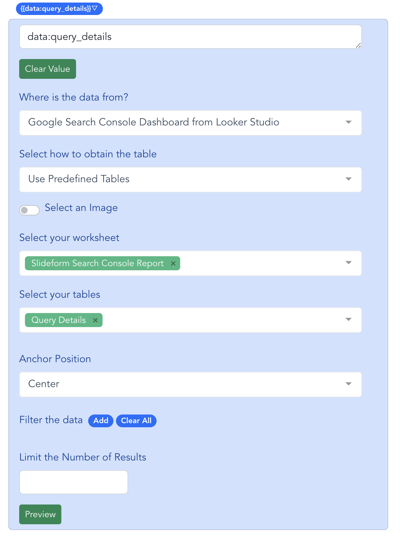
You may enter a number in Limit the number of results to set a maximum number of rows for the table. You can also select which columns to display and filter the data using all the available filters from your dashboard page.
Note: with these settings, the table will be inserted as a native table and is editable in the slides.
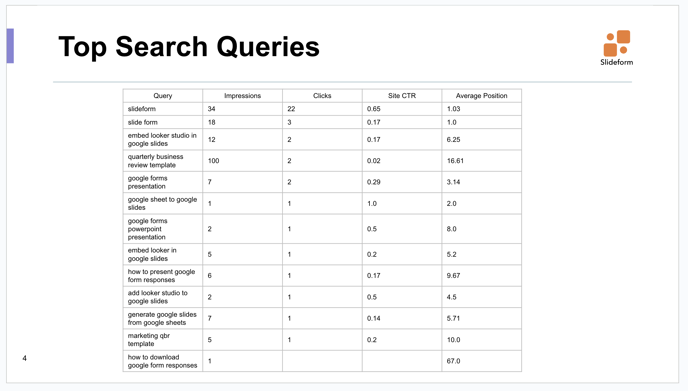
To insert an image of your table, with all the formatting and sizing from your dashboard, use a chart pragma. The table will not be editable in the slides.
Table from a database query
To embed a table of data from a database query, first choose Preset a Value and select the data source under "Where is the data from?"Example query for a table of data
SELECT *
FROM Cocktails.Recipes
WHERE `Primary Liquor` = 'gin'
Using formulas to calculate pragma values
You may calculate some pragma values from other pragmas within Slideform. Some examples are change or percent change, total, difference between two pragmas, etc. This is useful when you want to show a value in the slide output that is not found within the data source.
For example, my data source holds only the monthly price for a subscription. To calculate an annual price, I want to multiply the monthly price x 12. First, create a pragma to hold the annual cost in the slide template.
In the Configure Data screen for {{annual cost}} , choose "Type in a formula" and "Preset a value". For this example, I choose to format the data as currency ($).
Select "Use the value I type in" rather than selecting a data source. Then enter the formula in the text box:
12 * {{monthly rate}}
This tells Slideform to calculate the value based on the value of the {{monthly rate}} pragma.
Using hidden pragmas
It can be useful to create a pragma to hold a value that is not actually displayed on the slides. These "hidden pragmas" can be used as variables within your project. They can help control slide visibility, calculate values, and store other useful data. Only text, numeric, and date pragmas can be used as hidden pragmas.
To create a hidden pragma, just enter the pragma, with curly braces, into the slide template in the Speaker Notes of your slide deck template. On the Configure Data page, you will see a blue box for the pragma and you can set it up as you would any other pragma.
How to create a dropdown menu
You may want the user to select a value from a dropdown when they generate the slide output. Some examples are generating a report for a specific client or a particular data range. In this example, I will choose the sales person that will be displayed on the slide deck.
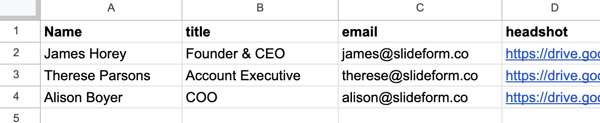
In this example, the data source (a Google Sheet) has the sales team names, emails, and headshots. To create a dropdown, choose "Select from dropdown" under "How should the user enter their answer?" This means that when the user clicks Generate, they will be shown a dropdown to choose a value for this pragma.
Then click "Preset a value". Set any formatting, then select the data source. Note, you do not have to use a data source. You can also choose "Use the value I type in" and enter the values as a list in the text box.
If you selected a data source, select the metric depending on the data source type. In the example below, I used a Google Sheet and selected the worksheet and column (KPI) that has the sales team names. Click Preview to see the values that will be presented to the user in the dropdown menu.

Using data filters, sorting, and applying functions
Data lookups from a spreadsheet or data table
For the pragma {{ae_title}} I want to get the person's title, given that I already have their name stored in another pragma.
I preset the {{ae_title}} pragma value to the appropriate data source, worksheet, and KPI (column) for the title information. Then under Options, I enter a filter as shown.

The filter is on the Name column and the value is the pragma {{ae_name}} . This will select the AE title where the Name equals the name in the "ae_name" pragma. Note that the "ae_name" has to be set elsewhere in the data mapping for the filtering to work.
Applying filters to a dashboard
Project filters
It can be very helpful to filter the entire project to a particular date range, client, or other filter available on your dashboard. Set project-level filters at the top of the Configure Data page. This will be applied to all pragmas, where appropriate.
Filters on individual pragmas
You can filter any pragma value by any available filters from your dashboard, just click Add and select the filter and value. Pragma-level filters override any project-level filters in place. Use the preview button to see the results.
Apply a function
Slideform supports several useful database operations to get the data value for a pragma. This is useful for summarizing multiple data values (from a table or sheet) to get a single value such as the total, max, min, average, etc. Use the preview button to see the results.
Choose columns
If the pragma is a table, you may select which columns to include in the output. Use the preview button to see the results.
Sort
If the pragma value is a list or table with multiple rows, you may sort the output by any available variable. Use the preview button to see the results.
Limit the number of results
If the pragma value is a list or table with multiple rows, you may limit the number of rows by entering a numeric value in the "Limit the Number of Results" box. Use the preview button to see the output.
Contact us at support@slideform.co for help 😀